


Strategies with the use of the indicators are popular trading systems, which are widely used by Forex market traders. Quite often, these strategies are based on the use of 2 or 3 indicators, and a task of a trader is to determine a point when all the indicators give identical signals for entering the market. A strategy described below is based on the use of 5 indicators, which increases the accuracy of determining an entry point and consequently, makes this strategy one of the most profit-making. The other advantage of this strategy is its versatility, as it is applicable to all trading instruments. This strategy can be used on the timeframes starting from M15.
Indicators to be used:
- Moving Average (Period 8, Smoothed, HLC/3)
- Moving Average (Period 18, Smoothed, HLC/3)
- Parabolic SAR (0.026, 0.5)
- Stochastic (12, 12, 5)
- MACD (8, 21, 1)
Conditions required for making a buy transaction (Fig.1):
- The line 8 MA is above the line 18 MA
- MACD histogram is above the zero
- One of Stochastic lines crosses the level 50 from bottom to top
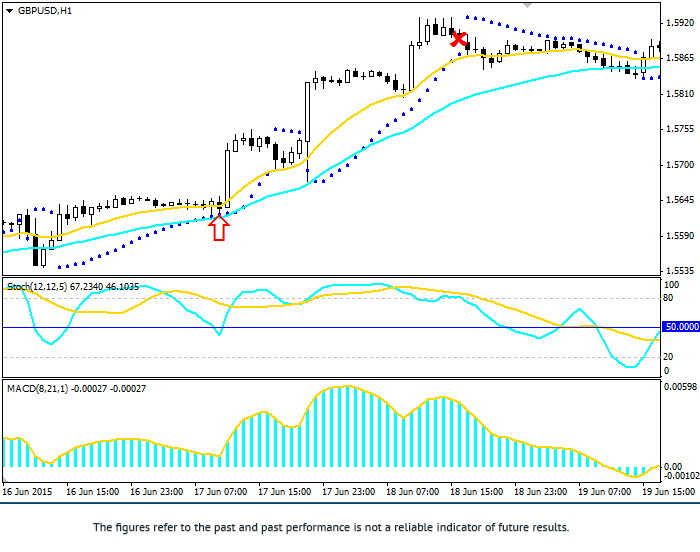
Fig.1
Conditions required for closing of the transaction: Parabolic SAR has changed direction from upward to downward.
Conditions required for making a sell transaction (Fig. 2):
- The line 8 MA is below the line 18 MA
- MACD histogram is below the zero
- One of Stochastic lines crosses the level 50 from top to bottom
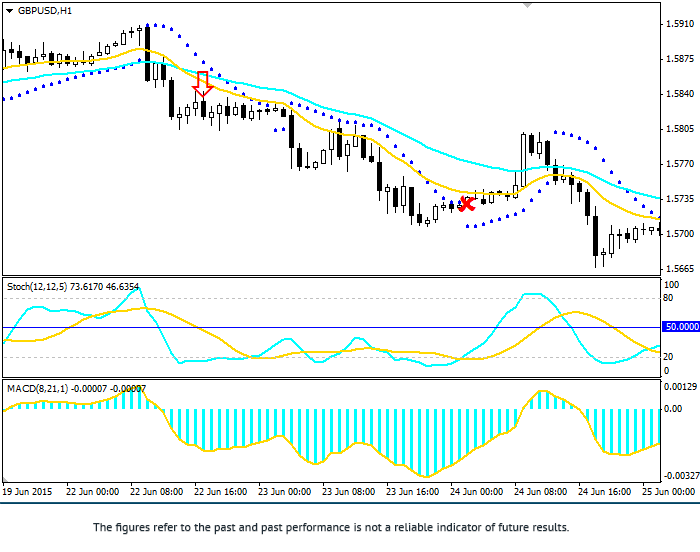
Fig.2
Conditions required for opening of the transaction: Parabolic SAR has changed direction from downward to upward.
One of the most traded currency pairs in Forex is the EUR/USD. Numerous day traders depend on these currencies. Most traders try different strategies to squeeze out profit. However, one has to make sure they don’t make silly mistakes. Not following economic news is like a crime in the Forex trading world. While most platforms claim to offer the news service, significance is a question. There might be a lot of noise. Then again some new services may not be enough. In such cases, NFP is a great choice. The non-farm payroll is an important report. People take up various strategies to trade NFP Forex.
First Friday every Month:
The US Bureau of Labor Statistics releases the NFP report every month. It is released on the first Friday. It reflects statistics of unemployment which is highly relative as per currency values. People also get an idea about job growth.
Other numbers include change in forecast of employees in the US. However, employees of farm, NGO organizations etc are not included. Just after the data release, there are huge movements in price. These movements take place only minutes leading to volatility. And traders can take advantage of it. This is NFP Forex trading.
Favourable Currency Pairs:
For traders who like to trade the EUR/USD pair, NFP is vital. A good strategy for them is to trade NFP Forex. Waiting till data release is crucial. EUR/USD is probably the heaviest traded pair. And that’s why it provides tight spreads. There is enough movement in prices after NFP release. So, traders of this pair probably stand the chance to benefit the most.
When to Close Positions:
Another crucial thing is the time. NFP release takes place right a 0830 Eastern Time. But those who trade NFP should close trading positions before this time. In fact, you should stop trading at least 15 minutes earlier. Wait until the release. Only after seeing the initial move after release you take a position.
Charts to Follow:
After the release the chart shows a trend initially. That is an important phase in NFP trading. A 1-minute chart is available. This chart tells you what positions to take on seeing a trend after data release. There is generally a price movement of around 30 pips. This is right after the release.
Setups to Trade NFP Forex:
Once a trader gets a direction, a setup is needed. For example:
- After an initial trend, a pullback occurs. This must be along five price bars of 1 minute. This pullback must survive 4 price bars. Or else it won’t be a trend.
- In case the initial trend was upwards, pullback will be downward and vice versa. But these reverse trends shouldn’t be higher or lower than initial price movements of the data release.
- Once the price crosses the trend-line, it’s time to trade. NFP Forex trading is as simple as that.
There are other alternative trade setups. Different traders take successive strategies. But this works for most people who trade NFP Forex. This is not rocket science. NFP reports are used by traders of other financial markets too. Forex traders have been taking advantage of it for quite some time now.
Forex is a 24 hour market. There is no respite. One can trade in foreign currency whenever one wants. But then not everyone is a full time Forex trader. There are many traders who do it part time. They see it mostly as supplemental income. Such part time traders generally have a day job. They take to trading Forex at night. With online trading now easy to access, such mode of trading is easily possible.
Markets are Calmer:
Trading Forex at night is quite different though. It is much calmer than during day. In fact American markets are quite inactive at this time. European markets too are not very active. That doesn’t mean you can’t trade at night. You can trade any currency you want. Regulations are uniform all through the day.
Asian markets in Full Flow:
Asian markets are quite active at night. However, experts say Asian markets are quite volatile. One can suffer losses due to high fluctuations. Also, trading only during night would mean a loss of opportunities. In fact, if the traders don’t adjust positions before the market moves, losses can be huge. This is especially true for inexperienced traders. Night trade Forex thus needs good strategy. You don’t want to suffer losses while trading after a hard day’s work.
Proper strategies for Trading Forex at Night:
There are some strategies that work well for part time night traders. Take a look at some of these:
- Recognize your Market
Forex market is global. But its activity depends on where you stay on this planet. In the North American region, night-time trading is quite common. That’s because most other full-time traders are inactive.
Knowing about the active markets lets you choose currency pairs. For example, New York market closes at 1700 EST. After that you wouldn’t see the USD Showing too much movement. But the Japanese Yen or Australian Dollar could be a good choice to trade.
- Make sure of Stop-Losses
Since most night traders are part time traders, trading time is minimal. But platforms allow you to keep losses away. For long trades, you can set a Stop Loss in such a way that in case of volatile movements, your money doesn’t go down the drain. The computer does that for you.
- Consider Long-Term Trades
Long-term trades are important. Hourly trades are useful for full time traders. For part-timers daily or weekly charts give a better picture. Even if you sit on your computer once a day, that will be enough for this tactic.
You must realize that Forex market is in constant flux. It is constantly changing. So even if you don’t observe charts all day, there are enough opportunities for making profits. You only need to implement proper strategy.
Part-Timers make Substantial Profit:
Do not run with the obvious misconception of a lower income. It’s true that investing more time ensures more profits. And that is only fair. But there are many traders trading Forex at night who have made a fortune with the right strategy. You just need to stick to the right plan and stay patient.
Correlation is probably one of the most useful concepts in mathematics. The relation between two things gives us a clear picture. In fact, correlation is the interdependence between two or more things. It’s a statistical approach. In Forex, we trade with currencies. To be more precise, we trade in currency pairs. Each currency has a different value. Also these values keep changing. So similarly studying the relation between two or more currency pairs is useful in Forex. The concept called Forex correlation trading is a quite useful concept.
The Concept of Correlation in Currency:
This concept of currency correlation is important for Forex traders. Those used to trading Forex correlations can understand how a currency pair behaves with the movement of another pair. It helps them predict exit and entry points.
Types of Correlation:
In the world of correlation, there are 2 types:
– Positive correlation
This means both pairs move in the same direction. For example the Pound/US Dollar and Euro/US Dollar, both tend to move together. Both tend to trade up or down at the same time.
– Negative correlation
In this type both pairs move in opposite directions. Such relation is seen in Euro/US Dollar and US Dollar/Swiss Franc pairs.
Often, people can know such relation between more than two pairs. But the important thing is to use such trading modes for profits.
How it Works:
Forex correlation trading is not rocket science. What one needs to know is the relation between pairs. Firstly, you need to know which pair has a positive correlation. Now if you see a pair with a buy signal, you can expect a positively correlated pair to have the same signal.
In case you see a buy signal in a pair, you can sell a pair negatively correlated to the former. This way, you can make profit with two pairs. You can also avoid a potential loss. This is why trading Forex as per currency correlations is beneficial.
Some Unusual Movements:
However, this trading mode is not all black and white. This is because correlations keep changing. Global factors play a strong role. They affect the economy. As a result at times correlated pairs may not behave as expected. Commodity prices change currency values. So do economic policies by governments.
Thus, it is better to monitor relation between pairs over a large time period. Experts claim that looking at a 6 month correlation is generally safe. This gives idea about the relation between certain pairs. But then again, there is no guarantee that change won’t occur.
Reversals in Forex Correlation Trading:
Traders used to trading Forex correlations are also aware of certain features. These are empirical. For instance, when positive correlation between two pairs fall out, a reversal comes up. This reversal is at a support level or a resistance level. The support level is the line joining the points where upward trends stop. The resistance level is the same for downward trends. At such reversals one can earn pips.
These are generally small to medium sized earnings. These little things can go a long way in helping a trader. So take up Forex correlation trading and predict profit phases on your own.
Scalping is a popular Forex method based on short-term trading. It is aimed at making small profits from each open trade. Scalpers use minor price impulses and during the trading session, they always have the same problem — lack of time to analyze situation. Traders have to make decisions instantly. That is why it is so important for them to choose appropriate indicators and strategy for trading. One of the strategies designed for trading on the five-minute chart is Combined Forces Intraday or CFI.
Indicators and settings

According to CFI strategy traders search signals using three indicators. Each of them gives a signal confirming the signal of the other indicator. First of all, we will place trend indicator Parabolic SAR on the chart. We do not need to change its default settings of 0.02 and 0.2.
Parabolic SAR shows current trend direction. It is the first indicator, which gives the first signals. A trader shall not wait when the indicator starts to form points on the other side of the price. It is much more important to know general market direction and use it for trading. Points displayed below the price indicate uptrend; points above the price level show downtrend.
After that we place RSI oscillator Note that a trader shall slightly change its default settings. First of all, instead of the period 9 we set the period 14. In this case the indicator will give more conservative signals and filter out most of the false signals. It is also necessary to change overbought and oversold zones. They should have the values of 35 and 65.
RSI should be placed outside these zones, that is, the moving average should be between the levels of 35 and 65. If RSI goes beyond these levels, a trader shall cancel a trade, as the signal is considered false.
The third and last indicator used in CFI strategy is Stochastic Oscillator with the settings of 5, 8 and 3. Unlike RSI, the lines of this Oscillator shall be inside overbought or oversold zone, as it will serve as a confirmation of a signal.
We know that when the price goes to one of the Stochastic zones, it does not a signal of the price reversal, as the price may continue to move in the same direction for a long time. However, the developers of the strategy based the strategy on the fact that probability of the price reversal increase when the price goes to the overbought/oversold zone. So, we have installed all the indicators and now, we can start to search signals.
Strategy specifics

Let’s see what conditions shall be met for forming a buy signal in accordance with CFI strategy:
- Parabolic SAR points shall be below the price level.
- Moving average of RSI shall be in the channel between the lines 35 and 65.
- Stochastic shall be in the oversold zone and start to reverse.
- Last candlestick shall close higher that the last sell point of Parabolic.
Note that the latter condition is very important. The chart shows that the first candlestick, which changed the location of points in Parabolic SAR indicator, has closed above the last point for sale, which means that the signal was given at the moment of opening of the second candlestick. This is a moment for placing a buy order.